When Traffic Never Sleeps: Detecting Bots with Entropy
Asaf Botovsky|
Threat Intelligence | February 02, 2026
TL;DR: We used entropy to detect bots by measuring how uniformly their traffic is distributed across hours. Legitimate users sleep; bots don’t. At entropy threshold 3.9, we achieve 99% corroboration with existing detection while catching sophisticated bots that evade all other methods. Analysis covered 253 million events across 35 million IPs.
The Problem with Modern Bots
Sophisticated bots have become remarkably good at evading detection. They rotate user agents, mimic human click patterns, and increasingly use residential proxy networks to blend in with legitimate traffic. Our existing detection systems catch the vast majority of these threats – but we’re always looking for complementary signals to strengthen our defenses.
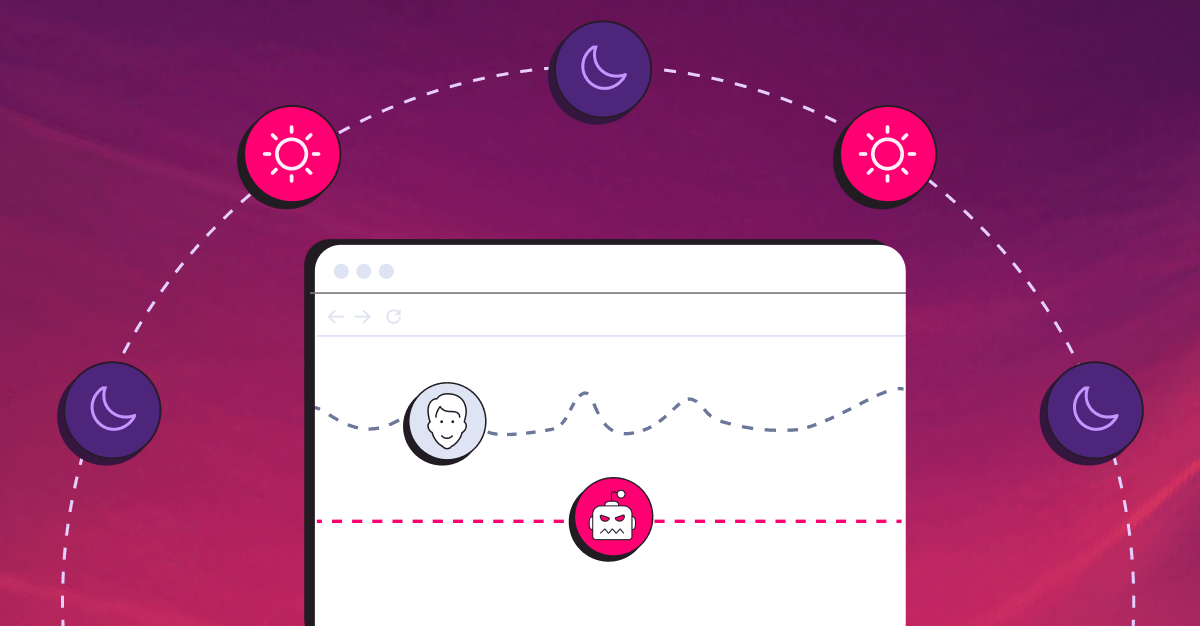
But there’s one thing bots can’t fake: they never sleep.
While most detection systems focus on what traffic looks like, we discovered that when traffic occurs tells an equally compelling story. This insight led us to develop an additional detection layer based on entropy that complements our existing methods and provides coverage for edge cases.
The Key Insight: Humans Have Rhythms
Every legitimate user has natural patterns. We wake up, check our phones during the morning commute, browse during lunch, and wind down in the evening. Even the most dedicated night owls eventually sleep. Weekends look different from weekdays. These patterns aren’t just individual quirks – they’re fundamental to human behavior.
This extends beyond individual users. Consider a shared IP address behind a corporate NAT or a residential proxy. Even with dozens of users sharing the same IP, they’re typically in the same timezone, following the same cultural rhythms. Traffic from a New York office building peaks during Eastern business hours and flatlines at 3am, regardless of how many employees share the connection.
Bots and proxy networks operate differently. They’re optimized for throughput, not authenticity. A proxy service routing requests 24/7 produces unnaturally uniform traffic. A botnet coordinating across compromised devices generates activity at all hours. This isn’t a signature we can blocklist – it’s a behavioral pattern that emerges from the fundamental economics of fraud.
Imagine a retail store where customers arrive at perfectly even intervals – exactly 4.17 people per hour, every hour, including 3am on a Tuesday. That’s not natural foot traffic; that’s a script.
Shannon Entropy: Measuring Uniformity
To quantify this intuition, we turned to information theory. Claude Shannon’s 1948 work on communication gave us a mathematical framework for measuring randomness and uniformity in distributions.
Entropy measures how spread out or uniform a distribution is. The formula:
H = -Σ p(x) × log₂(p(x))
Where p(x) is the probability of an event occurring in time slot x. Higher entropy means a more uniform distribution; lower entropy means traffic is concentrated in fewer time periods.
For hourly traffic distribution across 24 hours, the maximum possible entropy is log₂(24) ≈ 4.58 bits. This represents perfectly uniform traffic – exactly the same number of events in every hour of the day.
What entropy values mean in practice:
| Entropy | Interpretation |
|---|---|
| ~2.0 | Active roughly 4 hours/day – typical individual user |
| ~3.0 | Active roughly 8 hours/day – active user or small shared IP |
| ~3.5 | Active roughly 12 hours/day – very active or moderately shared |
| ~4.0+ | Active nearly 24/7 – highly suspicious |
The power of entropy is that it captures the shape of the distribution, not just summary statistics. An IP with 1,000 events spread uniformly across 24 hours scores high entropy. An IP with 1,000 events concentrated during business hours scores low entropy, even though the volume is identical.
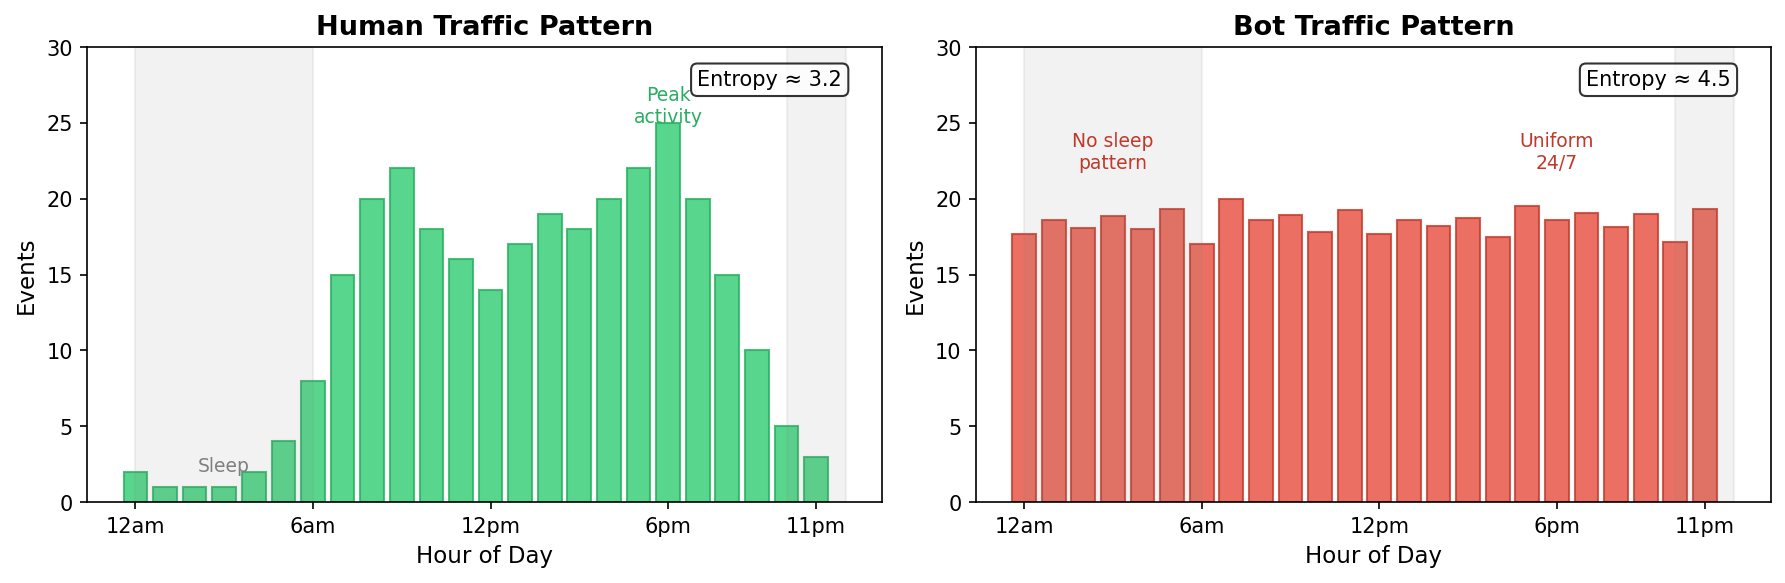
Left: Human traffic shows natural peaks during waking hours and valleys at night (entropy ~3.2). Right: Bot traffic is nearly uniform across all hours (entropy ~4.5).
The Detection Algorithm
Our approach is conceptually straightforward:
- Collect 24 hours of traffic data per IP address
- Calculate hourly entropy – how uniformly is traffic distributed across hours?
- Flag IPs exceeding the threshold – high entropy suggests bot-like behavior
- Aggregate to network blocks – if multiple IPs in a /24 subnet show the pattern, flag the block
We require a minimum of 10 events per IP before calculating entropy. Below this threshold, the sample size is too small for meaningful analysis – an IP with 3 events in 3 different hours isn’t necessarily suspicious, just sparse.
For network-level detection, we aggregate suspicious IPs into their /24 CIDR blocks (cblocks). A cblock is flagged only when at least 3 suspicious IPs are observed from at least 5 total IPs in that block. This guards against flagging a network based on a single anomalous IP while effectively catching coordinated infrastructure.
The system runs every 4 hours in production, analyzing approximately 250 million events across 35 million unique IPs per execution.
Scientific Threshold Selection
The critical question: what entropy threshold should trigger a flag?
Set it too low, and you’ll flag too many edge cases – power users, shared IPs, and legitimate 24/7 services. Set it too high, and sophisticated bots slip through. We needed an empirical approach.
The Validation Framework
We tested thresholds from 2.0 to 4.5 and measured how well each correlated with our existing detection systems:
- Corroboration Rate: What percentage of flagged IPs have independent signals confirming them? Higher is better – it means entropy detection aligns with established methods.
- Strong Signal Rate: What percentage have 6+ independent detection reasons? These represent high-confidence catches.
- Majority Fraud Rate: What percentage have >50% of their traffic flagged by other detection methods?
Results
| Threshold | Flagged IPs | Corroborated | Strong Signal | Majority Fraud |
|---|---|---|---|---|
| 2.0 | 1,062,086 | 86.5% | 36.3% | 36.0% |
| 3.0 | 383,481 | 93.0% | 55.0% | 47.1% |
| 3.5 | 157,323 | 96.6% | 75.2% | 63.6% |
| 3.9 | 79,674 | 99.2% | 92.6% | 83.7% |
| 4.1 | 55,355 | 99.8% | 96.8% | 92.0% |
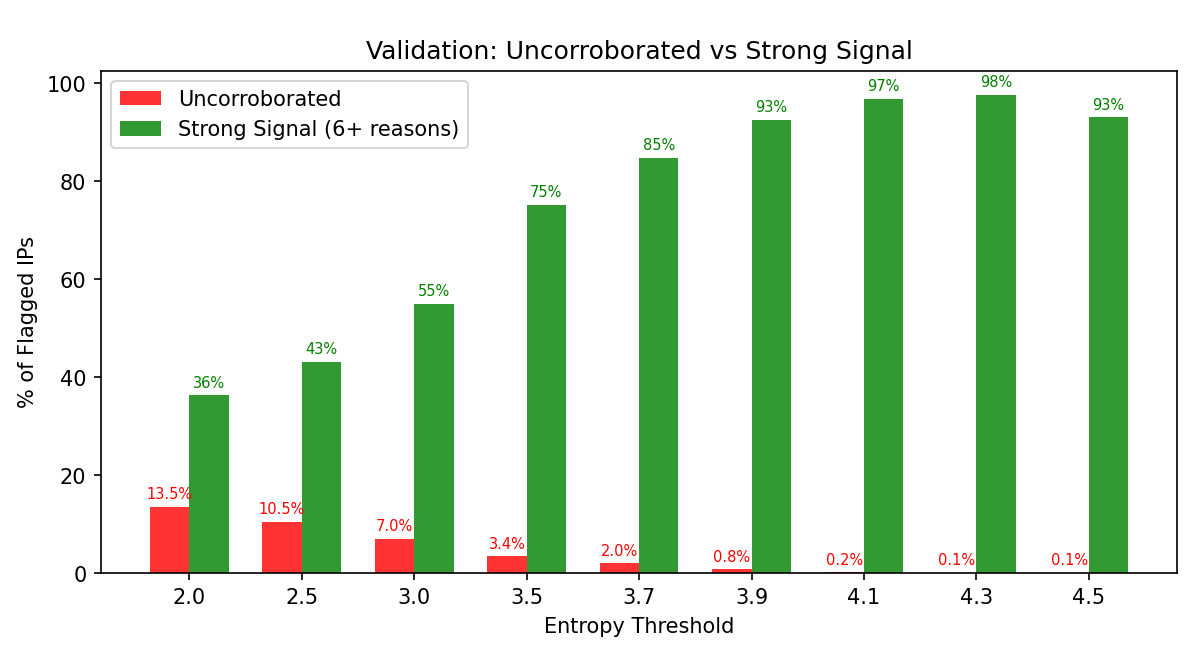
As threshold increases, uncorroborated detections (red) shrink to near-zero while strong signal rate (green) climbs to over 90%.
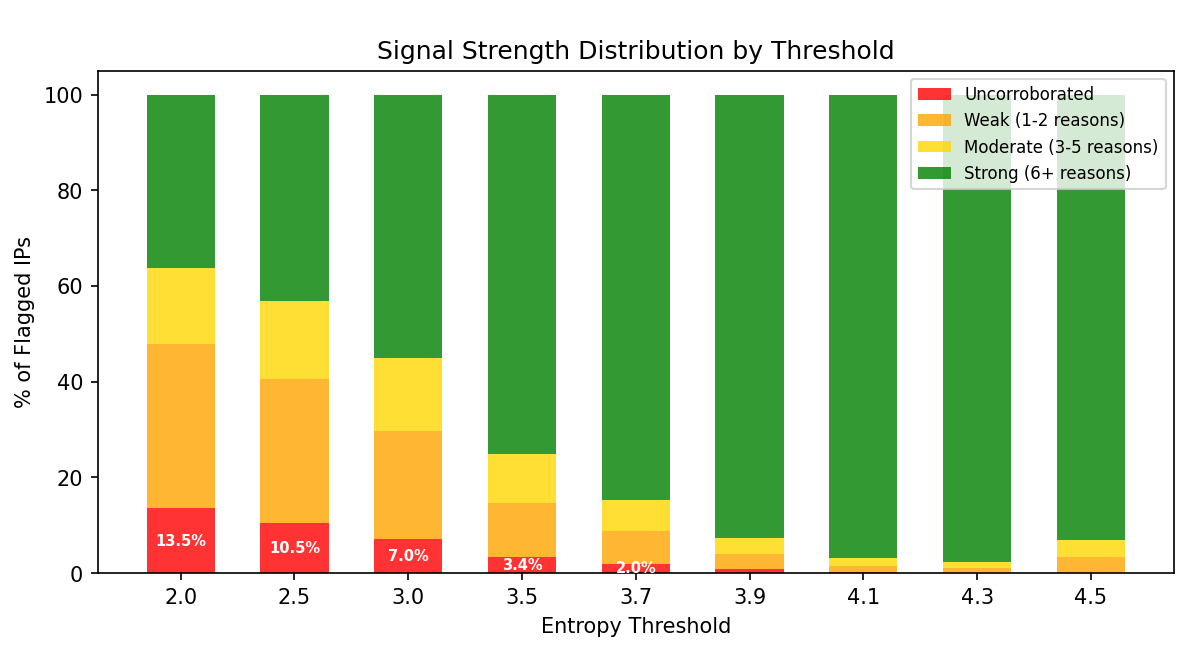
At threshold 3.9, the vast majority of flagged IPs show strong independent signals (green), with minimal uncorroborated detections (red).
The Sweet Spot: 3.9
At threshold 3.9:
- 99.2% corroboration – nearly every flagged IP has independent confirmation
- 92.6% strong signal – over 9 in 10 have 6+ detection reasons
- 83.7% majority fraud – most flagged traffic is already known-bad
The ~7% that aren’t already strongly detected? That’s the method’s unique value – sophisticated bots that evade signature-based systems but can’t hide their temporal fingerprint.
Real-World Validation: The Case of the Invisible Bot
To stress-test the system, we manually inspected 10 random IPs flagged at threshold 3.9.
Results: – 9 out of 10 IPs had a 100% detection rate the following day – confirmed bad actors – 1 IP was the interesting one
The Cloud IP That Evaded Everything
One flagged IP came from a major cloud provider. Its next-day traffic showed:
Hourly Distribution:
Hour Events Detected Suspicious Clean
0 847 0 0 847
1 892 0 0 892
2 831 0 0 831
…
22 879 0 0 879
23 901 0 0 901
Active hours: 24/24
Detection rate: 0%
Zero detection. Every single request from this IP was classified as clean by all existing detection systems. The user agents looked normal. The click patterns seemed legitimate. The request frequency was reasonable.
But the IP was active in every single hour of the day with remarkably consistent volume. That’s not human behavior – that’s automation.
This is the power of temporal analysis: catching bots that are sophisticated enough to evade signature-based detection but can’t fake sleeping.
The NAT Objection
A common pushback: “What about shared IPs? NAT? Corporate networks? Airports?”
This concern is valid to raise – but we tested it empirically with three different experiments.
Experiment 1: User Agent Diversity
If airports and hotels were being falsely flagged, those IPs would have high user agent diversity (many real users = many different browsers). We measured UA diversity for flagged IPs:
| Category | Avg Unique UAs |
|---|---|
| Corroborated (known bad) | 31.5 |
| Uncorroborated (potential FP) | 2.8 |
Uncorroborated IPs have 91% fewer unique user agents. Real shared infrastructure would have dozens of UAs – these don’t.
Experiment 2: Volume Analysis
Real airports would have massive traffic volumes. We analyzed event counts:
| Volume Bucket | Uncorroborated Rate |
|---|---|
| 10-499 events | 0.3-1.3% |
| 1K-5K events | 0.09% |
| 10K+ events | 0.0% |
At high volumes (where real airports would be), zero IPs are uncorroborated. The uncorroborated IPs are low-volume automated systems, not busy shared infrastructure.
Experiment 3: IP Classification
We randomly sampled 100 flagged IPs and classified them using IP reputation APIs:
| Classification | Percent |
|---|---|
| VPN/Proxy | 28% |
| ISP/Residential | 26% |
| Datacenter/Hosting | 23% |
| Mobile Carrier | 6% |
| Airport/Mall/Hotel | 0% |
Zero airports or hotels in the sample. The detection is catching exactly what it should: VPNs, cloud bots, and residential proxies.
The Bottom Line
Even shared IPs should show temporal patterns. Users behind the same NAT are typically in the same timezone, following similar cultural rhythms. A New York office’s shared IP doesn’t suddenly generate traffic at 3am local time. If it does, something is routing traffic through that IP artificially – which is exactly what we’re trying to detect.
The theoretical concern about false positives simply doesn’t appear in the data.
Infrastructure Discovery: Beyond Individual IPs
Temporal analysis reveals more than bad IPs – it exposes network infrastructure.
During our analysis, we discovered a particularly interesting pattern in a large IP range:
- 5,076 suspicious IPs across 73 different /24 subnets
- The subnets showed an alternating pattern:
- Even-numbered subnets (x.x.80.x, x.x.82.x): 140-200 suspicious IPs each
- Odd-numbered subnets (x.x.81.x, x.x.83.x): 50-60 suspicious IPs each
This structured allocation isn’t random. It reveals how the operator organizes their infrastructure – likely separating primary and backup IP pools, or segmenting by customer tier.
The implication: temporal analysis can identify not just bad actors, but the architecture of proxy networks. Rather than playing whack-a-mole with individual IPs, we can proactively block at the network level.
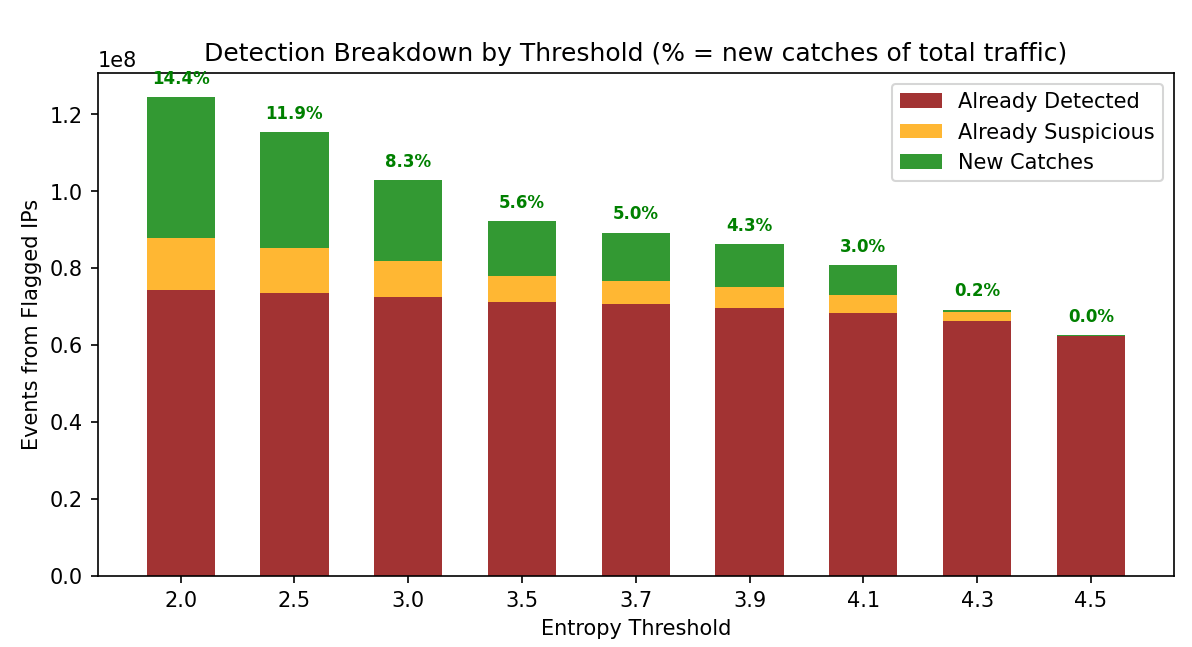
The green “New Catches” segment represents traffic from IPs flagged by entropy that weren’t already detected by other methods – the unique value add of temporal analysis.
Complementary Signals: Beyond Hourly Entropy
Hourly entropy is powerful, but it’s not the only temporal signal available.
Weekend Ratio
Legitimate traffic typically dips on weekends. Business users are home; even consumers browse differently. A weekend-to-weekday ratio close to 1.0 suggests traffic that doesn’t follow human weekly rhythms.
Night Activity Ratio
We calculate what percentage of an IP’s traffic occurs between 1am and 6am local time. Humans sleep; bots don’t. An IP with 25%+ of traffic during these hours warrants scrutiny.
Daily Entropy (7-day window)
Instead of hourly distribution within a day, measure distribution across days of the week. Maximum entropy here is log₂(7) ≈ 2.81 bits. An IP that’s equally active Monday through Sunday, with no weekend dip, scores suspiciously high.
Layered Detection
These signals are most powerful in combination: – High hourly entropy + no weekend dip + high night ratio = very high confidence – Each signal can be evaded individually, but faking all three consistently is expensive
The Arms Race: What If Bots Adapt?
The natural question: what happens when bot operators read this article and start mimicking human patterns?
Possible Adaptations
- Add artificial “sleep” periods to reduce entropy
- Simulate weekend traffic dips
- Introduce random timing jitter
Why This Is Hard for Attackers
- Coordination Cost Each IP needs its own believable pattern. A proxy network with 100,000 IPs can’t apply a single sleep schedule – that would create a detectable correlation. Creating unique, plausible patterns per IP is operationally expensive.
- Throughput Tradeoff Sleeping means less fraud. If a bot network introduces 8 hours of downtime per IP to look human, they need 50% more IPs to maintain the same volume. That’s a real cost.
- Geographic Consistency The pattern must match the IP’s geolocation. An IP geolocated to Tokyo shouldn’t show traffic patterns aligned with New York business hours. This requires accurate geolocation data and per-IP configuration.
- Combinatorial Complexity Faking hourly entropy is one thing. Faking hourly entropy AND weekend ratio AND night activity AND daily entropy AND geographic consistency together is substantially harder.
Counter-Moves
- Correlation detection: Look for suspiciously synchronized “sleep” times across different IPs
- Geographic validation: Does the pattern match the claimed timezone?
- Behavioral layering: Combine temporal signals with user agent analysis, click patterns, and conversion rates
- Adversarial monitoring: Watch for sudden distribution shifts that suggest evasion attempts
Lessons Learned
- Behavior beats signatures Temporal patterns are fundamental to human activity. Unlike user agents or fingerprints, they can’t be trivially spoofed by changing configuration.
- Entropy 3.9 is the sweet spot Our empirical validation found this threshold provides >99% corroboration with existing detection and >92% strong signal rate from independent methods.
- Validate with orthogonal signals The 93% correlation between entropy flags and existing detection gave us confidence we were catching real bad actors, not imagining patterns.
- Watch the edge cases The most interesting finding wasn’t the 9/10 confirmed bad actors – it was the 1/10 that evaded everything else. That cloud IP with 0% detection but perfect 24/7 activity validated the entire approach.
- Test objections empirically The “what about airports?” objection sounds reasonable in theory. But when we tested it with three different experiments (UA diversity, volume analysis, IP classification), zero airports appeared in our data. Don’t assume theoretical concerns are real problems – measure them.
Conclusion
Temporal entropy provides a powerful, complementary signal for bot detection. The core insight is simple: humans are predictable in their unpredictability – we sleep, we work, we take weekends. Bots are predictable in their uniformity – they optimize for throughput, not authenticity.
Multiple temporal signals – hourly entropy, weekend ratio, night activity, daily patterns – work better together than any single metric. Each is individually evadable, but the combination creates a robust behavioral fingerprint.
The 3am test: if your traffic looks the same at 3am as it does at 3pm, something is wrong. Humans don’t work that way. Scripts do.
Analysis based on 253 million events across 35 million unique IPs. Detection system runs every 4 hours in production.

Author
Asaf Botovsky
Co-founder & CTO Head of Threat Intelligence Team