How Bots Destroy these 6 Demand Gen Goals
Jonathan Marciano
Marketing
February 25, 2021
Demand generation leaders pour money into search traffic (for instance, Google Ads and Bing Ads) and paid social channels (such as Facebook, Instagram, and Pinterest). This is used to ratchet up dials, including customer lifetime value or average order value, and bring down negative indicators such as bounce rates (the amount of visitors that “bounce off” a site before buying) or shopping cart abandonment.
Digital marketing across these platforms is worth $144 billion each year. However, 10% of customer acquisition clicks are from bots, based on our analysis of thousands of campaigns across all paid search and paid social platforms.
In a smaller sample, CHEQ analyzed 30 retailers spending at least $500,000 per month on user acquisition campaigns. The analysis involved real analysis of bots clicking on creative ad campaigns designed to bring new relevant shoppers into the funnel. The cross-section of brands included a top global skin care brand, grocery sites, a DIY online marketplace, a fashion and sports retailer, a travel site, an online university, a personal finance provider, and a top provider of glasses and contact lenses.
How do bots actually behave when clicking on ads paid for by these multi-billion-dollar brands? What effect do they actually have on the core goals set by CEOs and demand generation leaders? Here, we look at six core demand generation metrics and the effect of daily bot attacks.
1. Bounce Rates
Bounce rates are the percentage of visitors who enter the site and then leave. Bots, clicking on ad campaigns, it turns out, bounce pretty quickly. Indeed, of the millions of clicks analyzed from bots on campaigns, 92% click, shoot, and leave. This satisfies the primary tactic of eating up ad budgets relied upon to bring in new customers. Bots clicking on paid search ads were found to click on branded search terms (the name of a company, business, or brand) 70% of the time. This brings losses of up to $70 per click, depending on the sector. In the case of one fashion e-commerce site, for instance, “men’s jacket” saw a 56% invalid click rate, “shoe coupon” a 52% invalid click rate, and “Asics New”, a 48% invalid click rate.
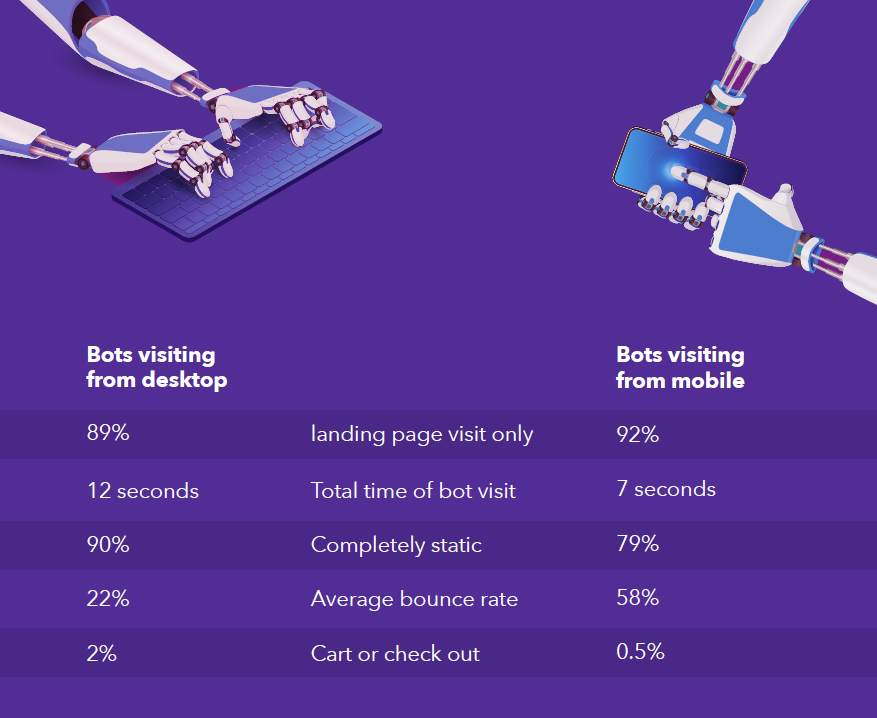
The bounce rate was 22% for bots arriving via desktop and 58% for mobile visits to click on ads. This compares to an average bounce rate of between 20% and 45% for most e-commerce sites. Most marketers accept that a range of 55-65% for bounce rates shows significant room for improvement, but the high numbers of bots discovered shows how clearly bots affect such metrics. Our analysis shows that the average bot actually stays on site for between 7 seconds (mobile) and 12 seconds (desktop). This is a high bounce rate but is designed deliberately by fraudsters not to arouse too much suspicion.
2. Cart Abandonment rates
The abandonment of shopping carts – that is a user skipping after adding items–is a $4 trillion problem for e-commerce, with bots playing a significant part in this headache. There are reams of e-commerce blogs with hacks to combat online shopping cart abandonment (better forms, adding progress indicators, better calls to action, or offering of a money back guarantee). However most fail to recognize that a significant minority of visitors don’t care about any of these psychological ploys. One in every 50 visits to the cart are from bots. This had the effect of clogging up online baskets, causing logistical and refund challenges. This included filling out forms and making purchases. Bots analyzed in our sample affected conversion rates, including online sales, leads, email signups, and form completions. In the case of a personal finance company this included “loan reverses”. This saw the loan company approve loans based on a specified criterion, only then to cancel it as details turned out to be fake or fraudulent. By tackling this problem heading straight to the cart or checkout, billions of dollars could be shaved off the large global shopping cart abandonment rate.
3. Conversion Rates
Conversion rate refers to the percentage of your visitors who take an action on your website. This action can be anything, such as signing up for an email newsletter or making a purchase. Unbounce found that the average conversion rate of landing pages is 9.7%, though this differs from sector to sector. Catering and restaurants (15.6%) tend to have a high conversion rate alongside media and entertainment (14.5%). Software companies among the highest victims of click fraud, alongside legal services see conversion rates of 9.1% and 11.8%. Home improvement sites, which have among the highest invalid click rates of any sector sees conversion rates of 6.1%.
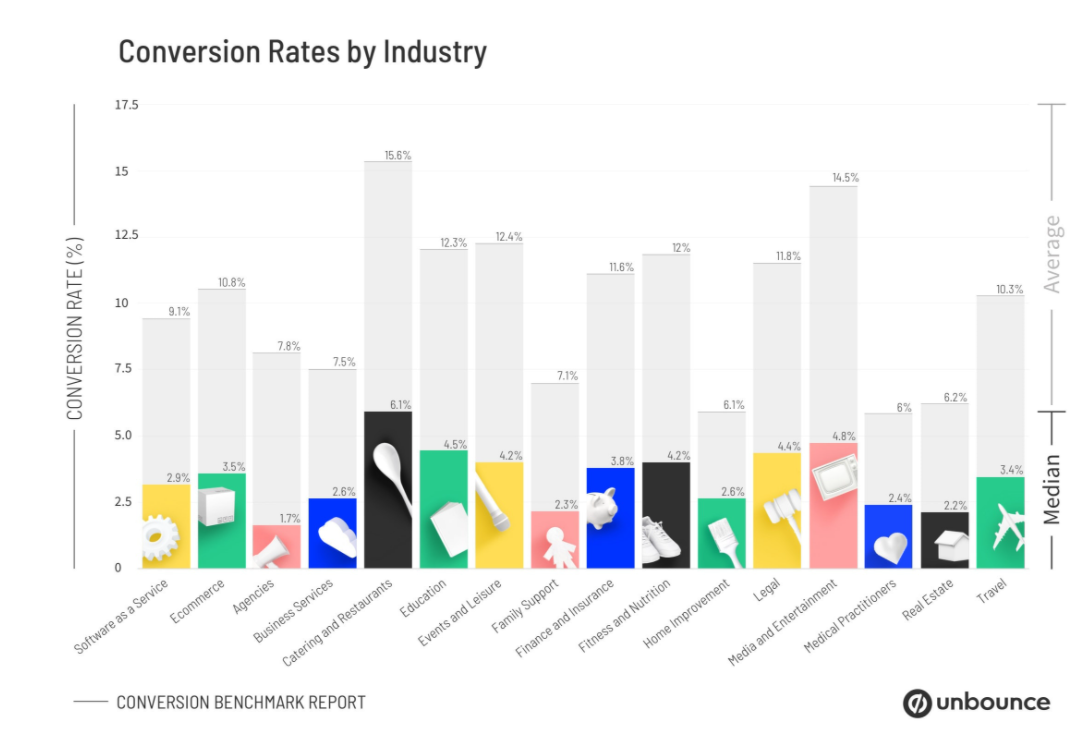
Removing bots can be a powerful means to improve conversion rates. Say that you get 20,000 visits to your website and that 2% of visitors convert and buy a $100 product, you will make $40,000. If you increase your landing page conversion rate by just 0.5% by preventing thousands of bots clicking you will make an additional $10,000.
4. Cost of Customer Acquisition
Customer acquisition cost – also referred to as CAC – is how much money it takes to “buy” a customer. This calculation is considered by businesses to understand how much it costs for marketing efforts to yield a new conversion or client. Knowing how to calculate your CPA is an essential method to keep tabs on your ad spend. This helps us plan how many customers we want to acquire in a certain time period and allocate marketing budget appropriately. When companies understand the levels of bots that can be removed, they may be able to reduce the costs of getting real customers. If things are not done to bring bots down it ceases to be just a marketing problem. In the words of Brian Kotlyar, Former Senior Director of Demand Generation, Intercom: “Put simply, if your customer acquisition cost is greater than your revenue for a long enough period of time, you’ll go out of business.” The freedom to choose the most effective channel without having to fear fraud is vital for any user acquisition manager. Those not tackling bots are likely to see diminishing returns for this spend.
5. Customer Lifetime Value
Customer Lifetime Value (CLV) is crucial in determining your business’ present and future success. It is an often-overlooked metric that can accurately predict how much your customers are really worth. Bots skew the data, particularly when, in 2% of cases, they end up checking out on your e-commerce sites or taking part in chargeback frauds, which then have to be deducted post-purchase. In one case in our analysis, a large company spent $ 7 million a month on paid search and paid social media channels. Our analysis found thousands of invalid clicks on their confirmation pages, indicating chargeback fraud, which has to be recalculated when the fraud is discovered.
6. Average Order Value
Average order value (AOV) is a useful measure of how much shoppers are spending. AOV is a simple calculation: the amount of revenue generated divided by the number of orders received. The challenge of bot attacks are seen for instance on big shopping events. In November 2020, Walmart’s Chief Information Security Officer Jerry Geisler revealed the company stopped 20 million PS5 bot purchase attempts in a half hour.
The same is true for bots clicking on ad campaigns offering promotions – we found 16% of all paid social was bot clicks on Black Friday(27 November 2020) and 28% on Cyber Monday (30 November 2020) distorting performance and the value of shopping carts. By replacing bots with real customers, the average order value of this metric increases sharply.
Overall, the ability to discover and discount invalid clicks helps in analysis for every demand generation metric. For instance, what is the true profitability of my advertising channel vs affiliate advertising? What is the true profitability of my Google advertising vs. Facebook advertising? What is the profitability of my Google non-brand advertising vs. Google brand advertising? What is the profitability of my bids on a keyword with no invalid or competitor clicks? What is the profitability of geo-location targeting when bots using VPNs and other devices pretending to be from the US or Europe are stripped away from reporting?
The impact of removing bots from the e-commerce equation is powerful. Reinvesting $14000 spent on bot clicks and replacing them with real human customers is expected to bring the average e-commerce player 163 additional customers a month. This is based even on a conservative estimate that only 55% of bots will be prevented. In addition, retargeting, which represents 4% of media spend across our companies, will become far sharper – targeting humans rather than new or returning bots. In the case of an online education portal, we found that removing 1213 bots per week with real leads, equated to 788 real human learners, 10 new enrollments and $150,000 more in revenue per month. The methods of bot removal also alerted our e-commerce players to other types of fraud – whether bot or not. This included instances of partner and affiliate fraud and long-term challenges from affiliate partners.
Removing this unnecessary wastage and replacing bots with qualified prospects allows more truthful metrics and the ability to hit core targets.
Secure your customer acquisition goals Today Click here to Request a Demo.