What is Click Fraud? How it Works, Examples, and Red Flags
Sanja Trajcheva
Cyber Risks & Threats
January 29, 2024
-
Click fraud occurs when fake or malicious clicks target your ads, wasting budget and distorting analytics.
-
It affects up to 90% of PPC campaigns and accounts for 10–20% of total ad spend losses.
-
Common sources include bots, click farms, malware, and spoofed domains.
-
High-risk industries include eCommerce, legal, healthcare, and travel.
-
Watch for sudden spikes in clicks, low conversions, or traffic from unusual locations.
Online advertising is a massive industry, with digital ad spend projected to reach $777 billion by the end of 2025. But as ad budgets grow, so does the incentive for bad actors to exploit them.
Enter click fraud – one of the most widespread and costly threats in digital marketing today. It affects an estimated 90% of PPC campaigns, draining ad budgets, distorting analytics, and hurting ROI across industries.
In this article, we’ll define click fraud, how it works, and why it’s become such a major problem for advertisers.
What is Click Fraud?
Click fraud refers to any fake or invalid click on online content. These clicks don’t come from genuine users and don’t lead to meaningful outcomes such as purchases, leads, or conversions.
Instead, they skew your analytics and create financial and reputational risks for your business.
Most commonly, click fraud targets online ads, a subset often referred to as ad fraud. Fraudsters might:
- Drain competitors’ budgets by repeatedly clicking on their ads, pushing them out of search results faster.
- Exploit pay-per-click systems by generating fake clicks on ads hosted on their own or third-party sites to earn ad revenue.
Because cost-per-click (CPC) rates can range from a few cents to over $100 per click (depending on the industry and keyword), even small amounts of fraud can quickly add up to significant losses.
But click fraud isn’t limited to paid advertising. It can also affect your organic marketing efforts:
Fraudsters may generate fake clicks on competitors’ organic search links, artificially boosting their rankings while lowering yours.
Some may even spam your social media pages with fake comments or interactions designed to damage your reputation.
In short, click fraud can hurt your business in multiple ways; from wasting ad spend and distorting performance data to reducing legitimate traffic and revenue. It’s a hidden but costly problem every digital marketer should understand and protect against.
In our State of Fake Traffic 2024 report, we determined that fake traffic, including click fraud, cost advertisers approximately $35.7 billion in 2022.
We discovered that almost 18% of all website visitors are invalid, which constituted a 58% increase from the year prior.
That means 10-20% of your PPC advertising spend is going to fraudsters or non-genuine online traffic.
How does click fraud work?
So, how do all of these fake clicks find their way to your digital activities? And why such a high volume of them?
Click fraud comes in many forms, from intentional defrauding to unintentional mistakes. To make sense of it, we’ll break them down into high volume and low volume.
High volume clicks
Botnets

A network of automated robots, or bots. Botnets are usually pieces of code that are operated remotely via a control and command (C&C) center. Criminals use them to carry out click fraud at a large scale and deliver high volumes of bot traffic.
These networks are usually multiple infected devices such as web browsers, phones, or computer servers.
Fraudulent botnets can have a significant impact on your business, carrying out coordinated cyberattacks or stealing data.
Data Centers

The weaponization of data center traffic plays a large part in the rise of fraudulent clicks.
Using data from CHEQ, for instance, we see that 10% of online ad fraud attacks involve data center bot traffic. Google, for example, identifies publisher fraud, where publishers run software tools in data centers to intentionally mislead advertisers with fake impressions and clicks.
In one case involving a fake click program called Urlspirit, there were more than 6,5000 data-center installations of the software, with each data-center installation running in a separate virtual machine. In aggregate, the data center installations of this software generated an average of 2,500 fraudulent ad requests per installation per day.
Click farms

When you think of a click farm, you might picture a large room filled with people repeatedly clicking on links. These setups are often used to make websites appear more popular than they really are, artificially boost social media engagement, or increase the visibility of certain posts or profiles online.
They’re like a call center but for fake traffic online.
Click farms are often found in developing nations where wages are much lower. However, in recent years, click farms have been switching to increasingly automated services.
A famous example is a click farm in Thailand which was busted by the police there. This included hundreds of phones and tablets connected to a server running automated processes, mostly clicking on social media links.
Web crawlers
A web crawler is an automated bot that is usually running quite mundane tasks. This can be anything from:
- Indexing websites for search engines
- Collecting data on behalf of other software, also known as ‘web scraping’
- Monitoring the web on behalf of government institutions, for example, looking out for fraud
Usually, web crawlers are not committing any acts of fraud. But they can be a regular source of fraudulent clicks.
Low volume clicks
Business Competitors
Keywords in many industries are both highly competitive and expensive. So, it’s no surprise that business rivals can use a bit of light click fraud to deplete PPC budgets and even knock one company’s ads off the search engine results for the day.
In fact, this is quite a common occurrence, especially in industries such as legal services, on-demand repairs or specialist services (i.e., plumbers, locksmiths, waste disposal), and finance.
In many of these sectors, keyword bids are regularly over $50, meaning just a few clicks can hit the pocket hard.
Vindictive parties
People seeking some kind of ‘revenge’ can easily hit you where it hurts online – in the wallet.
It might be a sacked employee, an estranged ex-partner, or a customer who didn’t like your service. If they spot your ad, they can click on it as many times as they like, draining your advertising budget every time they do.
Accidental or repetitive clicks
We’ve all clicked an ad by mistake, only to quickly close the page or click back once we realized it. These fat-finger clicks are a common source of invalid traffic, though most ad networks work to filter them out.
Similarly, repetitive clicks from the same user – intentional or not – inflate engagement metrics without leading to conversions.
Malware and click fraud

Click fraud from malware is a growing problem and one that the industry is struggling to defend against.
Malware is usually a software program, such as a web browser extension or app, that is infected with a bot, virus, or other software infection.
Once on a device, malware can be controlled remotely to carry out all sorts of digital tasks. This includes coordinated botnet attacks (also known as denial of service or DDoS), ransomware attacks, crypto mining, data theft, and click fraud.
This type of click fraud often uses click injection, or click spamming, to carry out its fraudulent activity. This means that the software will have an inbuilt bot that clicks away in the background on hidden ads and embedded ads or can even be used to visit external websites to view those ads too.
Domain spoofing
When it comes to defrauding advertisers, one of the most common practices is domain spoofing, also known as website spoofing.
This is where fraudsters create a fake version of an established website with the sole intention of displaying ads to collect the payout.
Some of the most successful ad fraud campaigns have used domain spoofing to devastating effect. Done right, an ad can be hosted on a spoofed site, viewed or clicked on by a bot or click farm worker, and a payout goes to the fraudster.
All without the advertiser or genuine publisher knowing a thing about it.
Despite several attempts by the industry to end website spoofing, it is still the most common way for fraudsters to collect payouts on fake video impressions and display ads.
Examples of Click Fraud
There have been several high-profile examples of click fraud exposed in the last decade.
Botnets and organized ad fraud
Using bots and malware to do click fraud bidding is the most effective way fraudulent advertisers hit a high volume of ad campaigns. This is usually done by a team of organized hackers and is the biggest ongoing threat in terms of digital fraud. Over the years, dozens of botnets have been discovered, costing millions in wasted spend for marketers.
Competitor click fraud
In more competitive industries, like retail or SaaS, a high cost per click (CPC) coupled with intense competition can result in the perfect conditions for click fraud. And yes, it happens, probably more often than you would think.
In one example, B2B software vendors in highly competitive markets report invalid click rates as high as9%.
Callum McKeefery, Founder & CEO of REVIEWS.io, explained how it affects his business:
“This has happened to us a lot. A competitor has continuously clicked on our paid ad. There was one device in Melbourne, Australia that clicked on our ad once every couple of days, but on really expensive keywords. These keywords cost between $13 and $19 a click. Competitors are doing this on hundreds of devices.”
Law firm throws the book at click fraud
JustLaw, a U.S.-based digital marketing agency for law firms, noticed something unusual while managing pay-per-click (PPC) ads for a DUI defense client. CEO Stephan Futeral spotted a sudden surge in suspicious click activity on their PPC ads.
Using click fraud detection software, he was able to increase conversion rates by 97%. With an average CPC of $50, blocking fraudulent clicks saved the client over $11,000 in a single month.
Click fraud legal cases

Although prosecutions for click fraud are still relatively rare, there have been several high-profile cases that highlight the issue.
Facebook vs LionMobi & JediMobi
Highlighting the issue of click injection and click spoofing malware, Facebook discovered that software from two developers was being used to click on FB ads in apps.
The developers, LionMobi and JediMobi, two separate developers from Hong Kong and Singapore, are accused of creating apps that contain malware to click on ads. The defendants actually claimed that the code might have come from an SDK rather than from themselves.
In 2021, Facebook reached a settlement in its case against LionMobi and JediMobi. As part of the agreement, both companies agreed to pay monetary damages and accepted a permanent ban from using Facebook and its Audience Network.
The LeoTerra case
The LeoTerra case is a prime example of harmful click fraud that ended with legal consequences for the fraudsters. It involved server-side ad insertion (SSAI), a sophisticated technique where fake ad inventory is created and injected into legitimate websites and apps. In LeoTerra’s case, the scheme targeted connected TVs (CTVs).
The scam was uncovered in July 2020, where the investigations uncovered a scheme that is part of an extensive operation of SSAI schemes known as OctoBot. The scheme used online device information sources where they download lists of devices and incorporate the device information inside their falsified ad requests. This makes it appear as if their fraudulent traffic is coming from millions of different devices.
At its peak, LeoTerra spoofed up to 20.5 million unique CTV devices per day, generating billions of fake ad impressions. In the first half of 2022 alone, three new variants of the LeoTerra scheme were identified. These three variants have spoofed more than 92 million devices during H1 and up to 3.5 million device signatures each day.
The sheer scale of this case highlights the need for better security measures and detection tools to combat sophisticated click fraud schemes and maintain trust in the digital advertising industry.
Fabio Gasperini
Italian national Fabio Gasperini was accused of creating a botnet that clicked on PPC ads and allowed him to access computers remotely.
Although Gasperini was acquitted in 2018, he was prosecuted for the lesser charge of computer intrusion.
In pursuing a conviction, the case was dismissed for containing vagueness, insufficient proof, and evidence obtained incorrectly. This highlights a key problem with pressing charges against alleged click fraud conspirators, as obtaining solid digital proof can be a hindrance to passing a guilty sentence.
The Methbot gang
In one of the few successful prosecutions for ad fraud, Kazakh nationals Yevgeny Timchenko and Sergey Ovsyannikov were sentenced to prison sentences in the US for their roles in the Methbot and 3ve bot campaigns.
Aleksandr Zhukov was also charged with his part in the 3ve ad fraud campaign.
There were also charges for Russian associates Mikhail Andreev, Boris Timokhin, Denis Avdeev, and Dmitry Novikov, although they remain at large.
Motogolf.com vs Top Shelf
The impact of click fraud on businesses is highlighted in the case of Las Vegas-based online golf equipment retailer Motogolf.com in the US District Court of Nevada.
The sports retailer sued a competitor, alleging they violated federal and state law by repeatedly clicking on Motogolf’s pay-per-click online Google ads. According to the court complaint, once viewers have clicked the set number of ads in a given day, the ads become “exhausted” and are no longer visible to potential customers.
Beyond the immediate cost of the problem, Motogolf also claims it is losing “valuable demographic data about prospective customers.” The problem cost the company at least $5,000, according to Motogolf. The golf retailer claims in its complaint that its competitor employees used various electronic devices to intentionally click on Motogolf’s online pay-per-click ads “in an illegitimate manner calculated to cause damage to Motogolf.”
Sectors most affected by click fraud
Click fraud can affect up to a quarter of all clicks on pay-per-click (PPC) ads. For some industries, the fraudulent click volume can be even higher, costing billions for some sectors, based on analysis by the University of Baltimore and CHEQ.
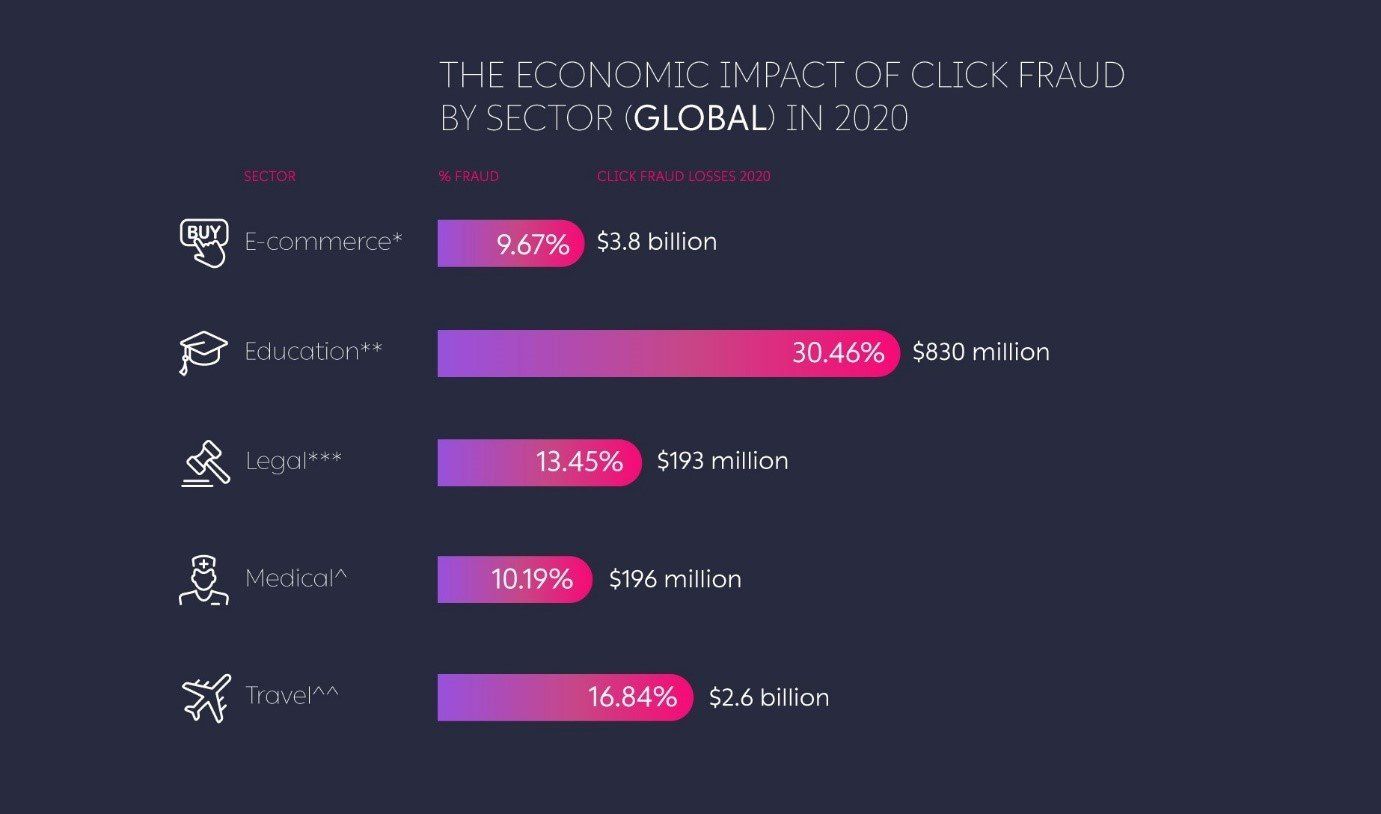
We see that eCommerce lost $3.8 billion to the problem in 2020 alone. Education PPC advertisers suffered $830 million. Legal marketers grappled with an annual setback of $193 million, while medical and healthcare advertisers saw their losses reach $196 million, and online travel faced an impact of $2.6 billion.
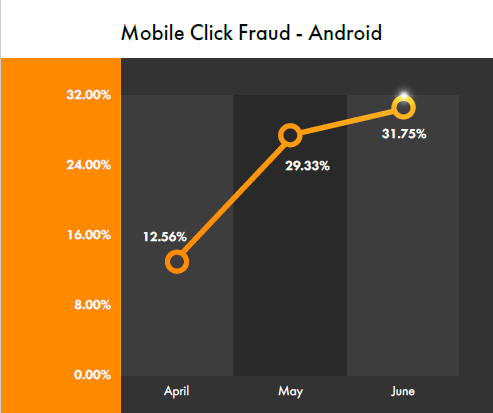
Click Fraud: Mobile vs. Desktop
In an analysis of 1.8 billion clicks, 14% of paid search traffic was determined to be fraudulent. Of this fraud, 85% involves click fraud using mobile devices, compared to desktop click fraud (15%). The study found that Android devices play the largest part in rising mobile click fraud, accounting for more than three-quarters (81%) of mobile-based invalid clicks compared to 19% on IOS devices.
Signs of click fraud
If you consistently see one or more of the following warning signals happening to your PPC ads, you might need to look at ways to minimize your exposure.
High bounce rates
There can be many reasons a visitor clicks your link and then clicks back within a few seconds. It might not be what they’re looking for after all, or maybe your landing page was slow to load or badly designed. These issues can be fixed with some better wording on your ads and a bit of a landing page tweak.
For Google Ads PPC campaigns, a bounce rate between 40% and 50% is generally considered healthy.
If your bounce rate is below 40%, it suggests your audience is engaging well with your landing page.
However, if your bounce rate rises above 60% to 70%, it may indicate a mismatch between your ad and landing page, or potential click fraud inflating unqualified visits.
Start by reviewing ad relevance and landing page quality, and if those check out, investigate for invalid or fraudulent clicks that could be driving inflated bounce metrics.
Want to learn more? See our guide on How to Filter Invalid Clicks in Google Ads.
Spikes in impressions and clicks
Spikes in impressions and clicks can be a result of a successful offline ad campaign, seasonal trends, and other external factors that may be hard to quantify.
But a spike coupled with one of the other factors on this list might suggest fraudulent activity.
Peaks in clicks or impressions at strange times, such as the middle of the night, might suggest traffic coming from overseas. Which, if you don’t target foreign shores, could be suspicious.
High traffic but low conversions
Lots of clicks equals lots of conversions, right? Not necessarily. If you regularly see a low conversion rate, again, it might be worth looking at your ad first.
Consider features such as your call to action or how easy it is for your site visitors to complete the required action (check out, get in touch, etc.).
If you’re seeing spikes in traffic volumes and no corresponding rise in conversion rates, this is a big red flag.
Unusual location
So, I mentioned the peaks in traffic from overseas, which might not be so strange if you’re an internationally focused company.
But, sometimes, even locally targeted ads can see traffic from an unusual location. By using VPNs (virtual private networks), users can get around location settings and view ads meant for a targeted audience.
For instance, in one case of an enterprise DIY eCommerce site, a client for CHEQ for PPC, our cybersecurity technology discovered campaigns on paid search and paid social that achieved 14,000 fraudulent clicks from VPN used to mask location. The actual location is primarily from China and Malaysia (masking their location as UK buyers), which is considered invalid by the client as they do not ship to these regions.
If you’re regularly seeing traffic on your ads coming from some obscure country, dig into the IP address and consider using software to block fraudulent traffic.
Dive deeper into the art of detecting click fraud.
How to prevent click fraud on your ads
There are tried-and-true ways to stop click fraud, and many PPC platforms offer varying levels of protection.
Google, for example, has a dedicated team that works to identify and prevent invalid clicks around the clock.
Manual methods for preventing click fraud
Beyond platform safeguards, there are manual tactics that can help reduce your exposure to click fraud. Most of these are also smart PPC best practices that improve campaign efficiency.
Geo-targeting
Targeting your ads globally can waste budget and increase your risk of invalid clicks.It’s always best to target specific locations with localized campaigns that attract high-intent users, which allows you greater control over your ad budget and your PPC ads.
Regularly review your campaign data to spot suspicious activity, and exclude areas that might be known for fraudulent traffic.
IP address exclusions
In the context of click fraud prevention, monitoring IP addresses becomes crucial to identify and mitigate suspicious activity. They can easily reveal fraudulent activities.
For example, if you spot a large volume of clicks or website visits coming from the same IP address, it could indicate click fraud. Or it could be IP addresses from locations that you’re not targeting.
In such cases, you should add those traffic sources by adding them to the exclusion list in your Google Ads account.
Timing
Leaving your ads running 24/7? This is probably not the best way to get value for money on your pay-per-click advertising. Instead, choose the best times to target your ads, and you’ll be able to limit your exposure to fraud AND get a better return on ad spend.
Automated real-time click fraud prevention across all platforms

Who has time to manually tweak your PPC advertising to avoid click fraud? That’s where anti-click fraud prevention software comes into play.
CHEQ for PPC offers the most comprehensive protection against click fraud, protecting PPC campaigns of all shapes and sizes. Unlike other fraud prevention software, CHEQ doesn’t just block invalid clicks on Google.
CHEQ for PPC provides a complete click fraud prevention solution for any platform you spend money on, including Facebook, Pinterest, LinkedIn, Microsoft, Snapchat, and others.
P.S.
Want to protect your sites and ads against click fraud? Click here to Request a Demo.
Click Fraud: Frequently Asked Questions
What are invalid clicks?
The term ‘invalid clicks’ is usually used by the PPC platforms to refer to any non-genuine click on your paid ads. Although it can be used to refer to fraudulent clicks, it can also refer to:
- Genuine accidental clicks by site visitors
- Web crawlers
- Multiple clicks from the same source
For PPC networks like Google Ads, Bing, or Facebook, it sounds better than referring to fake clicks or click fraud.
But, to be fair to Google and Co, invalid clicks cover everything, not just fraud.
So, invalid clicks likely refer to the general volume of non-genuine clicks. Whereas click fraud or ad fraud refers specifically to those fake clicks with malicious intent.
How does Google detect click fraud?
Google has a process in place that detects click fraud. Any click that is not driven by a genuine user interest is classified by Google as an invalid click, and it won’t charge you for that.
Its mechanisms detect activities such as repetitive clicks from the same source, accidental clicks on an ad due to factors like poor ad placement, or bot clicks triggered by either legitimate bot crawlers or malicious bots.
While these measures only confirm Google’s commitment to its advertisers, large volumes of fraudulent clicks are still slipping through. Many marketers agree that Google’s parameters do not measure the full extent of click fraud, which increases the need for additional tools specifically designed to combat click fraud.
Final Thoughts
Click fraud is a growing threat that costs advertisers billions of dollars every year. From bots and click farms to sophisticated malware and domain spoofing, fraudulent activity can quietly drain ad budgets.
The good news is that awareness and prevention have come a long way. With advanced click fraud detection and invalid traffic prevention tools, advertisers can protect their data integrity, optimize ad spend, and focus on reaching real customers.
At CHEQ, we are building a safer, more transparent digital ecosystem by protecting teams from fake clicks, invalid users, and other forms of malicious automation.
If you are ready to learn how CHEQ’s click fraud prevention technology can help safeguard your campaigns and uncover hidden invalid traffic, request a demo today.

Author
Sanja Trajcheva
As an experienced content writer, Sanja is a firm believer in the power of storytelling to inspire and educate audiences. In her role at CHEQ, Sanja fearlessly tackles the challenges of the fake web – navigating through fake traffic, ad fraud, and click fraud. When not writing, she enjoys exploring new tastes and planning her next adventures.